Decision Support System
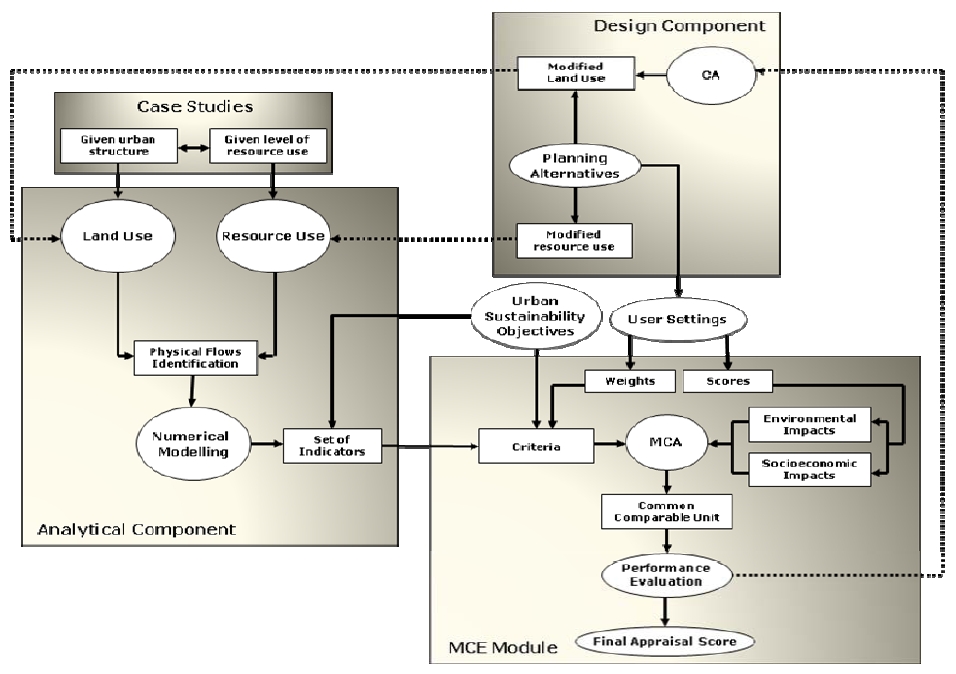
The BRIDGE DSS is based on an analytical and a design component, linking the bio-physical processes in urban environment with socio-economic parameters, as shown in Figure 1. The DSS estimates the trade-off between the environmental and the socio-economic dimensions of changes in the urban metabolism introduced by urban planning actions.

Figure 1: Conceptual illustration of the BRIDGE DSS.
The analytical component supports the assessment of the environmental impacts of the energy, water, carbon and pollutants fluxes, while the design component offers tools to assess different planning alternatives. These planning alternatives are practically modifications of land-use and resource and therefore modifications of the metabolism of the urban system. The link between the analytical and the design components is a Multi-Criteria Evaluation (MCE) module to supplement decision support capabilities. This module combines the environmental with the socio-economic aspects of urban metabolism and evaluates the performance of each planning alternative in terms of sustainability.
The environmental impact of urban metabolism for given urban structures and given levels of resource use in the case studies is addressed using the analytical component. The physical flows are identified using numerical modelling and a set of indicators is identified related to the urban sustainability objectives identified during participative processes (i.e. in consultation with stakeholders). This component has four major functions for analyzing energy, water balance, carbon and air pollutants and providing indicators which reflect the current state of the urban environment as well as the environmental pressures (or benefits) that every planning alternative will cause.
In the MCE module environmental indicators are combined with socio-economic indicators using a multi-criteria analysis approach. Both environmental and socio-economic indicators are at first evaluated, considering the modifications introduced by the planning alternative, in separate categories (i.e. commonly based on targets and thresholds set at European or national level). A score for each indicator results from this evaluation. The end-users determine the significance (i.e. weight) of the criteria defining weights according to their preferences.
The design component is used to handle and present modified land-use arrangements and practices for resource use on the basis of different planning interventions at specific sites in the case studies. These planning alternatives are provided by the end-users. Land-uses changes are handled in two scales. In the local scale, the planning alternatives provided by the end-users already include estimations of their impact. The modifications that they cause to urban metabolism are assessed by the analytical component on the basis of the estimation of changes in energy, water, carbon and pollutants fluxes. In a broader scale, these local land-use scenarios are used as inputs for a Cellular Automata (CA) model included in the design component, to simulate broader and long-term land-use changes. The broader scale scenarios obtained, are subsequently used to assess future environmental impacts on the basis of modifications to the physical flows that will be simulated by the numerical models included in the analytical component.

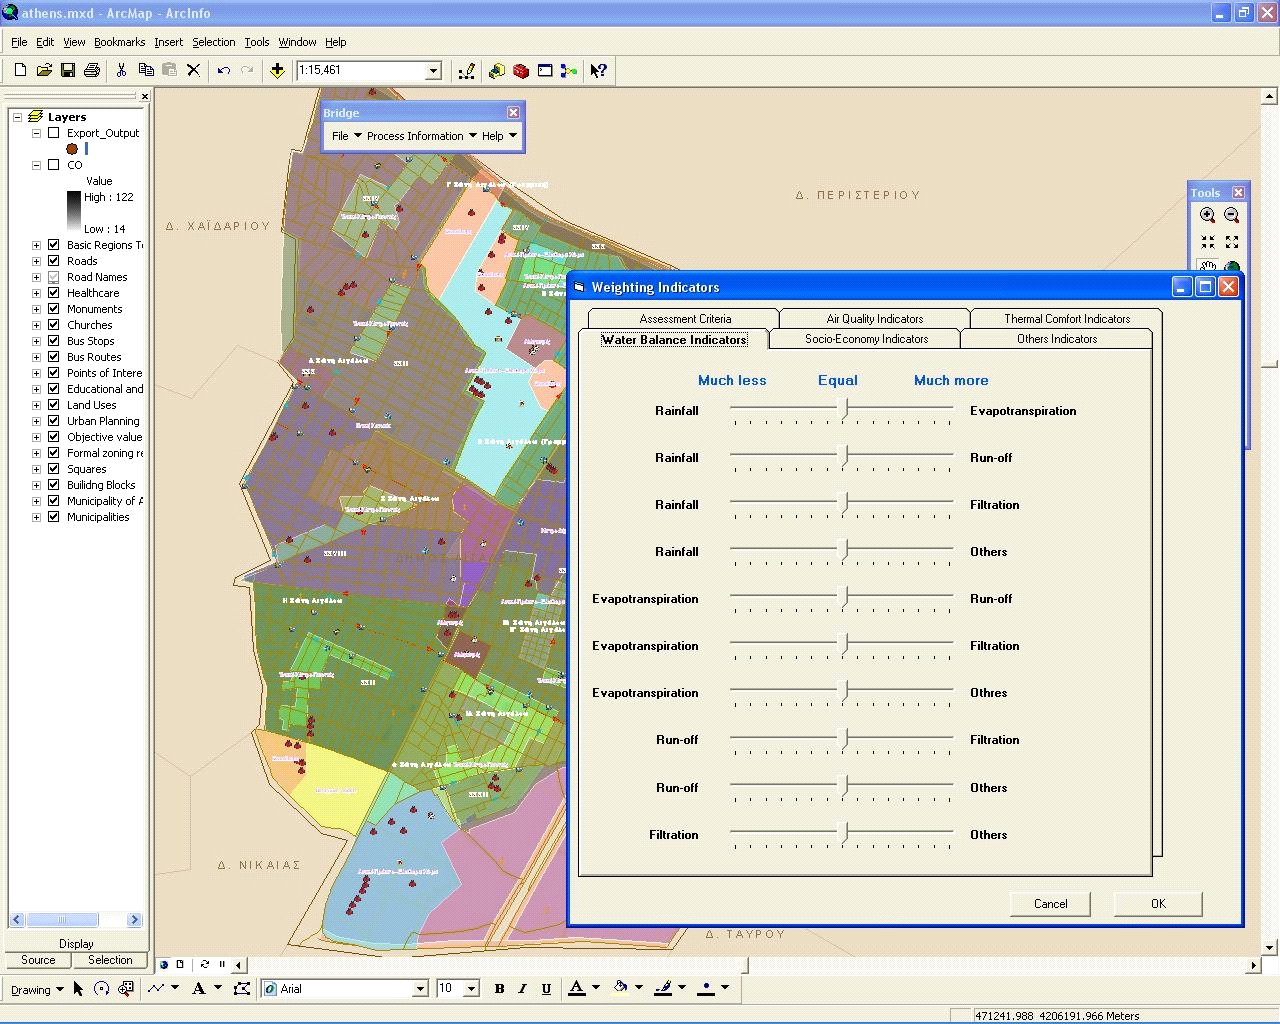
Figure 2: The GUI of the BRIDGE DSS.
The BRIDGE DSS framework is composed of modules serving different needs. The GIS module is used to integrate all datasets, analyze the various spatial entities, prepare the input for the physical flows models and the decision making models, store the results and then visualize them; the communication modules are used as middleware between the GIS and the physical flows models. The impact assessment module is used to assess the environmental and socio-economic components of urban metabolism; finally, the Graphical User Interface (GUI) (Figure 2) is used to provide the interaction between users and the DSS.
Decision Making Methodology
The BRIDGE DSS is based on sustainability objectives reflecting the intensity of the interactions among the different elements in the urban system (namely environmental and socio-economic) and are specific to each case study’s planning interventions (i.e. suited to address the end-user needs). A set of criteria are associated to such objectives providing a link between the objectives and the indicators and usually have time limits and/or thresholds associated with them. The DSS relies on indicators as inputs. Indicators demonstrate the level of achievement of each criterion, in a quantified manner.
Indicators for each planning alternative are provided in different ways: environmental indicators arising from measurement of physical quantities are calculated by spatial models; socio-economic indicators reflecting objective values (number of houses constructed, number of jobs created, etc.) are given as data attached to planning alternatives; value judgments (such as landscape or urban quality) are defined by end-users. The users define the relative importance of each criteria and indicators. Having all this information available, the scores are determined for each alternative, using the measurement scales previously defined. An overview presentation follows, enabling end-users to access the merits of each planning alternative and eventually to perform sensitivity analyses, by changing the values of indicators’ weights. MCE involves transformations of available datasets which characterize impacts of planning alternatives, resulting in a summary score. The idea of computing a summary score is to provide one measure used as the basis for ranking alternatives from best to worst.
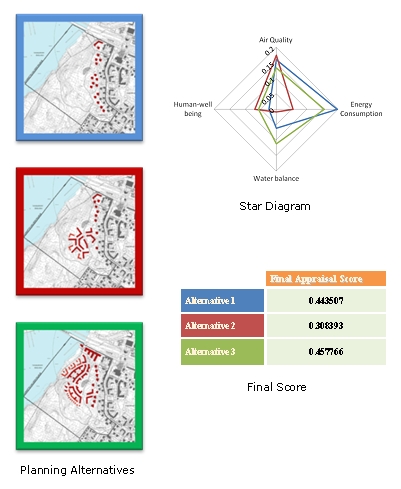
When assessing the performance of indicators, targets/thresholds are used (e.g. maximum value permitted according to European and national legislation), where possible, as reference points to establish the nature of the indicator’s performance. When targets/thresholds are not available, a comparable baseline is (e.g. business as usual scenario on an urbanized area where proposed alternatives consider upgrading the urban fabric), alternatives are contrasted against such do-nothing alternative (using it as a “reference” point). Where the baseline scenario is not comparable the alternatives are compared among themselves. This approach facilitates comparison and allows establishing which alternative represents the most suitable option. Therefore, it should be noted that the “reference” indicator is a determined threshold/target if such values exists at European or national legislation/guidelines for a given indicator (e.g. 50 µg∙m-3 PM10). If the defined value exists, the baseline value of the reference alternative is adopted. Figure 3 presents a DSS results example, where three planning alternatives are evaluated and the final score for each one is resulted.

Figure 3. A DSS results example.
