| |
|
| Home | |
| Project Descrition | |
| Project Objectives | |
| Methodology | |
| Main Stages | |
| Results | |
| Sensors Description | |
| Project Team | |
| Publications | |
| Products | |
| Contact us | |
| Links | |
Project Description Results |
||||||||||||||||||||||||||||||||||||||
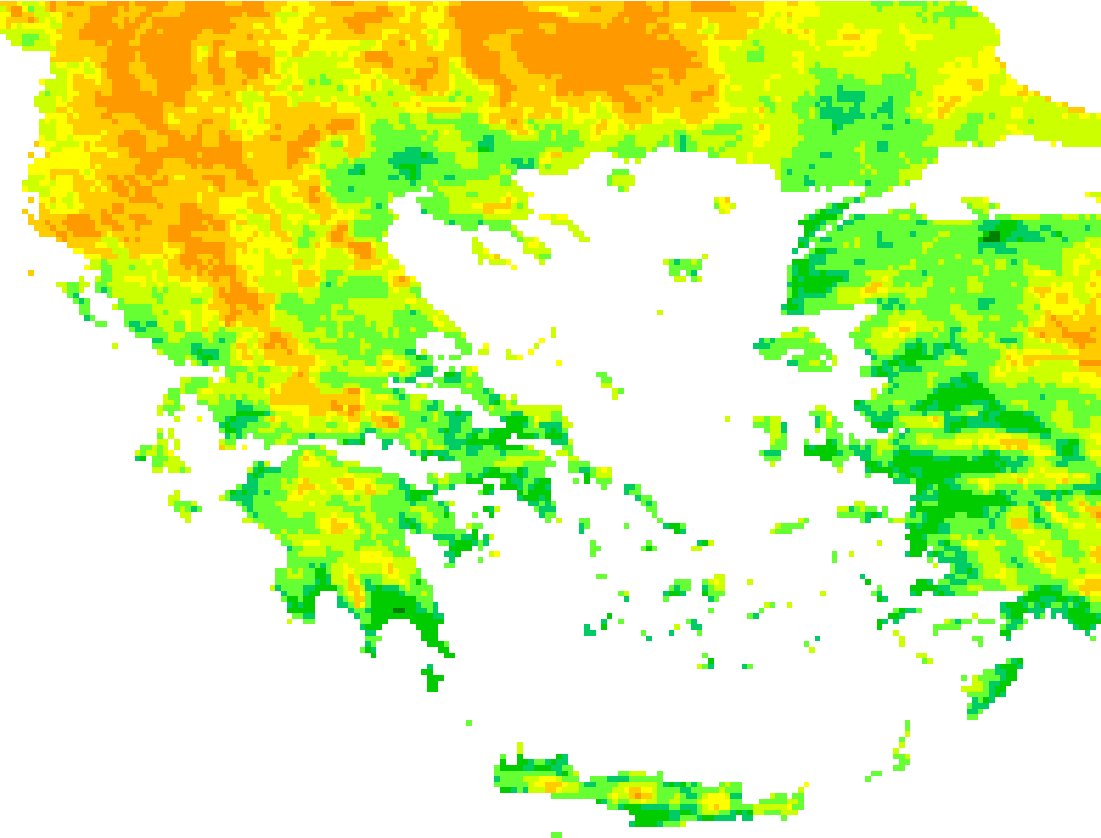
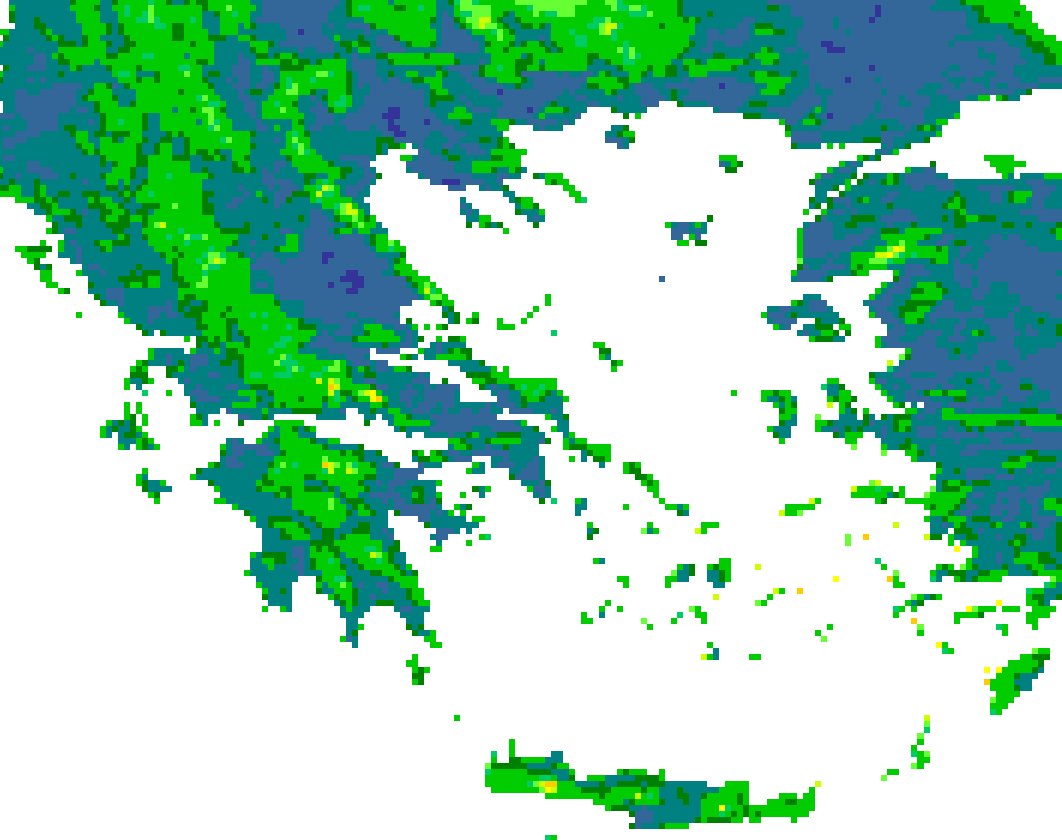
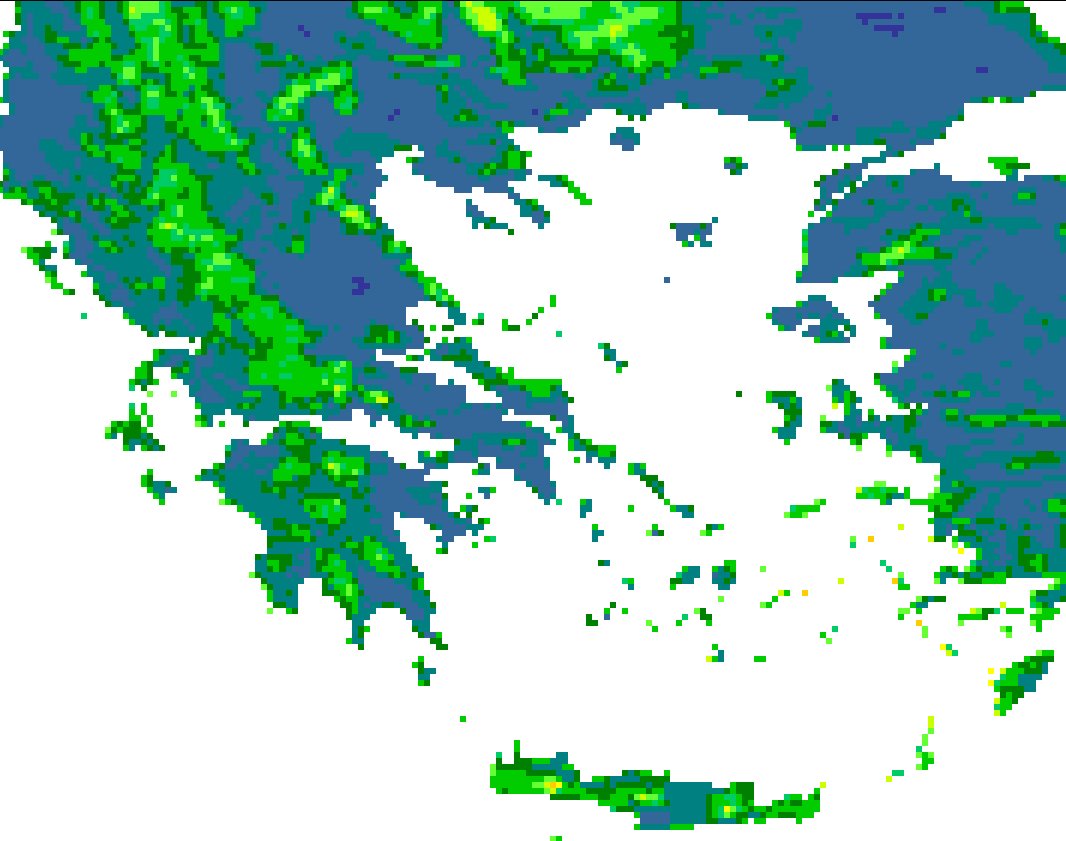
The analysis of MODIS Level 2 PW product was performed for October 2003, January, April and July of 2004. The spatial distribution of PW as derived by daily MODIS observations over the study area was estimated at 5 x 5 km cell level. Figure 1 displays the spatial distribution of MODIS-derived PW at 5x5 km level; mean values for the mid month of each season are presented. PW values over land were used, given that in this case the MODIS near infrared PW retrievals were reliable. The effect of topography is evident: lower PW values are observed over the west part of central and northern Greece (Pindos mountain chain), over the mountainous area of central Peloponnese, over the three main mountain chains of the Crete island, as well as over the mountainous areas of Turkey, Albania, Bulgaria and Former Yugoslavian Republic of Macedonia, for all seasons. Moreover the summer maxima and the winter minima of the PW distribution are depicted: mean PW maxima of 2.33, 0.98, 1.48 and 3.86 cm, correspond to October, January, April and July, respectively.
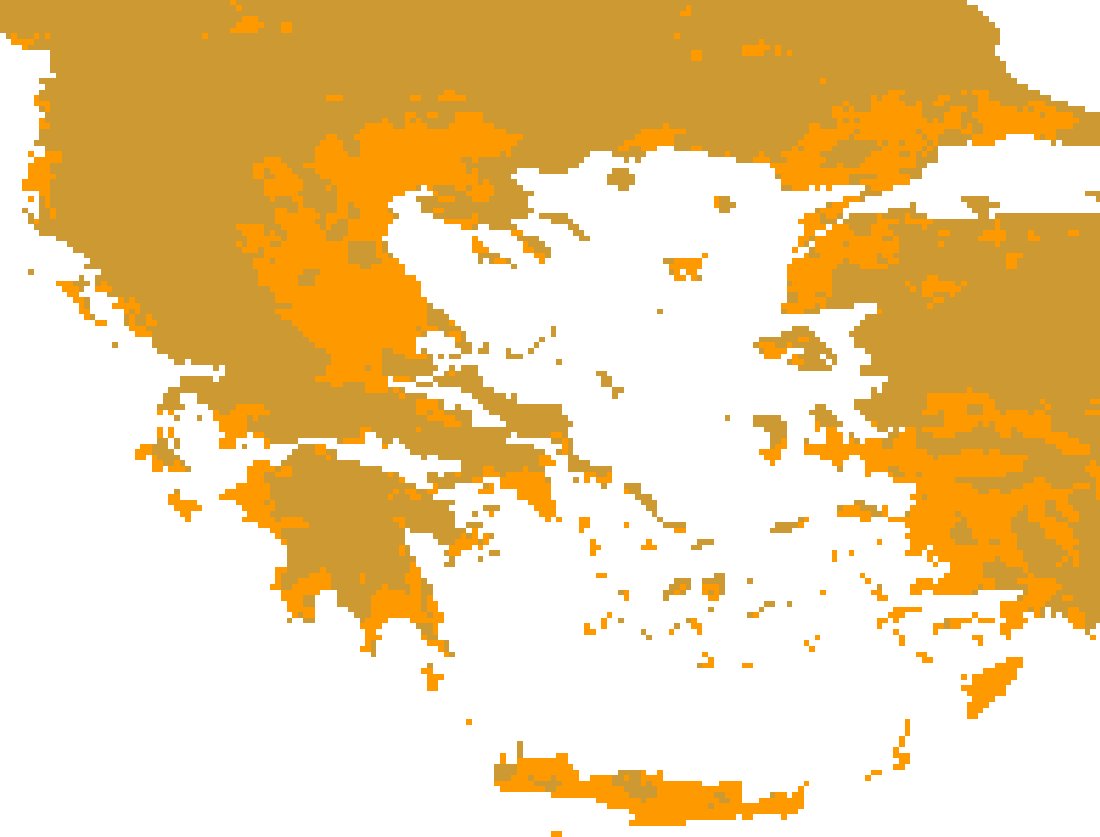
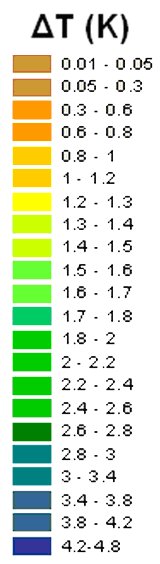
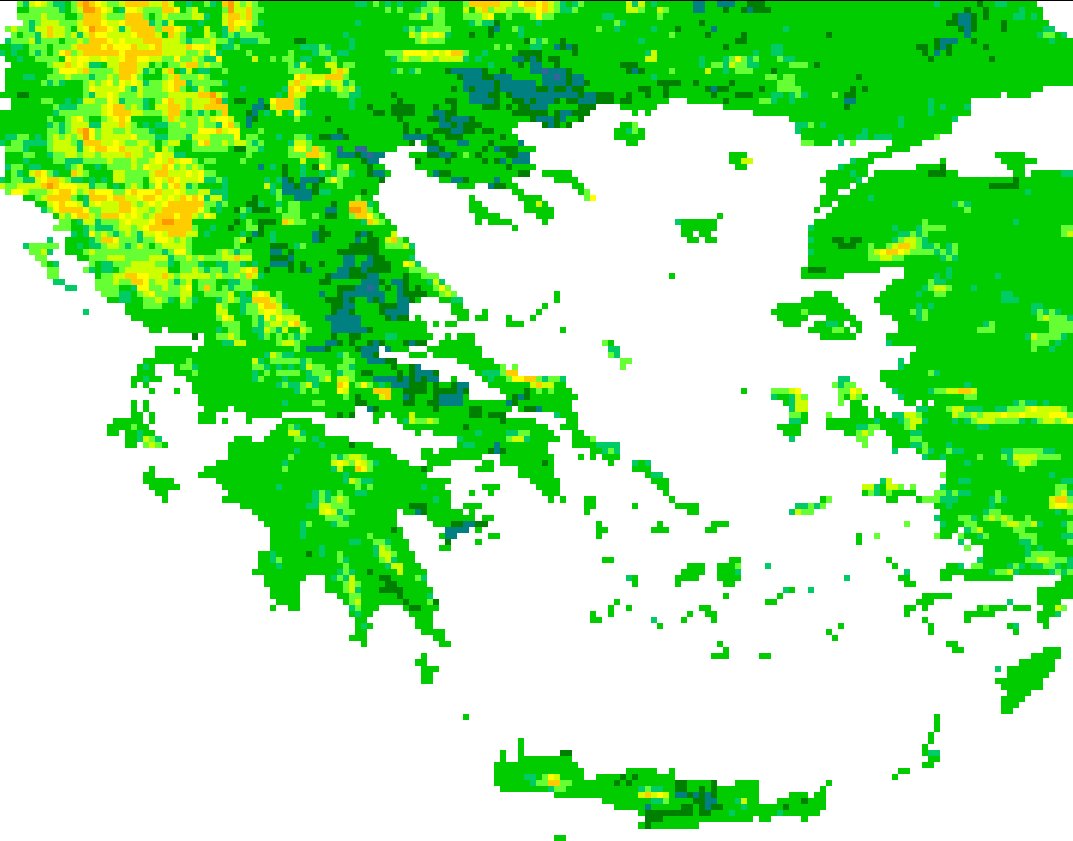
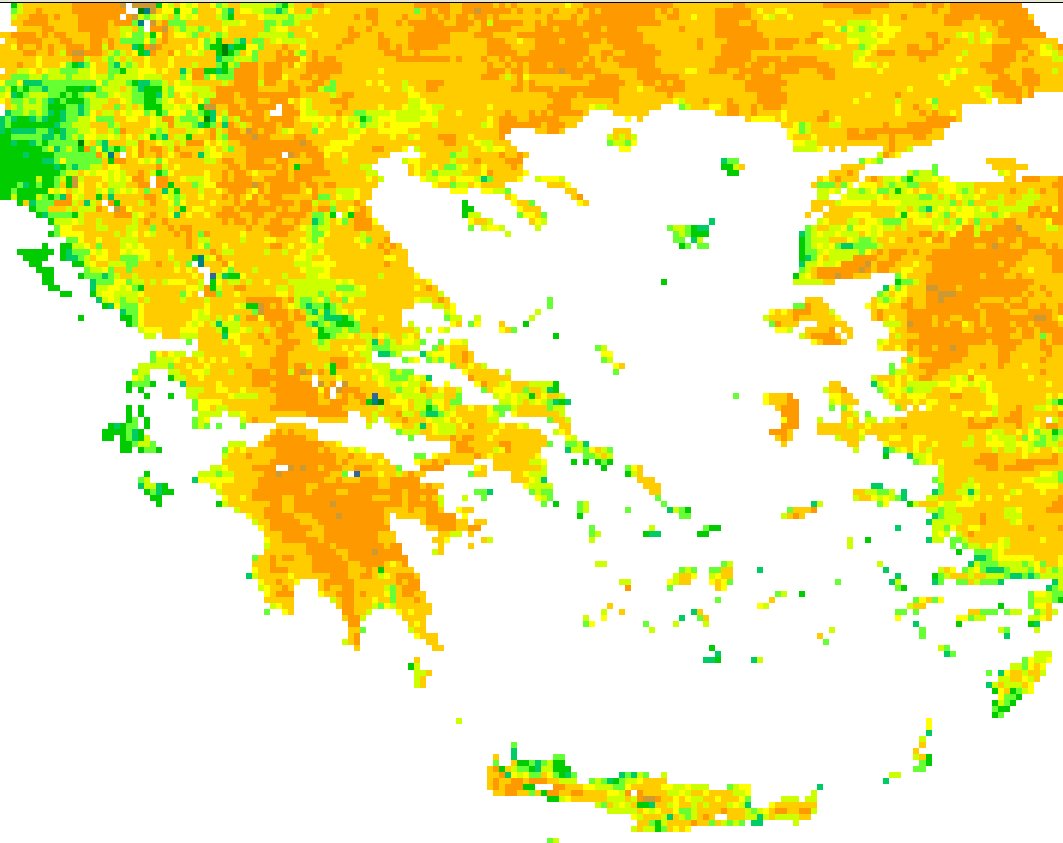
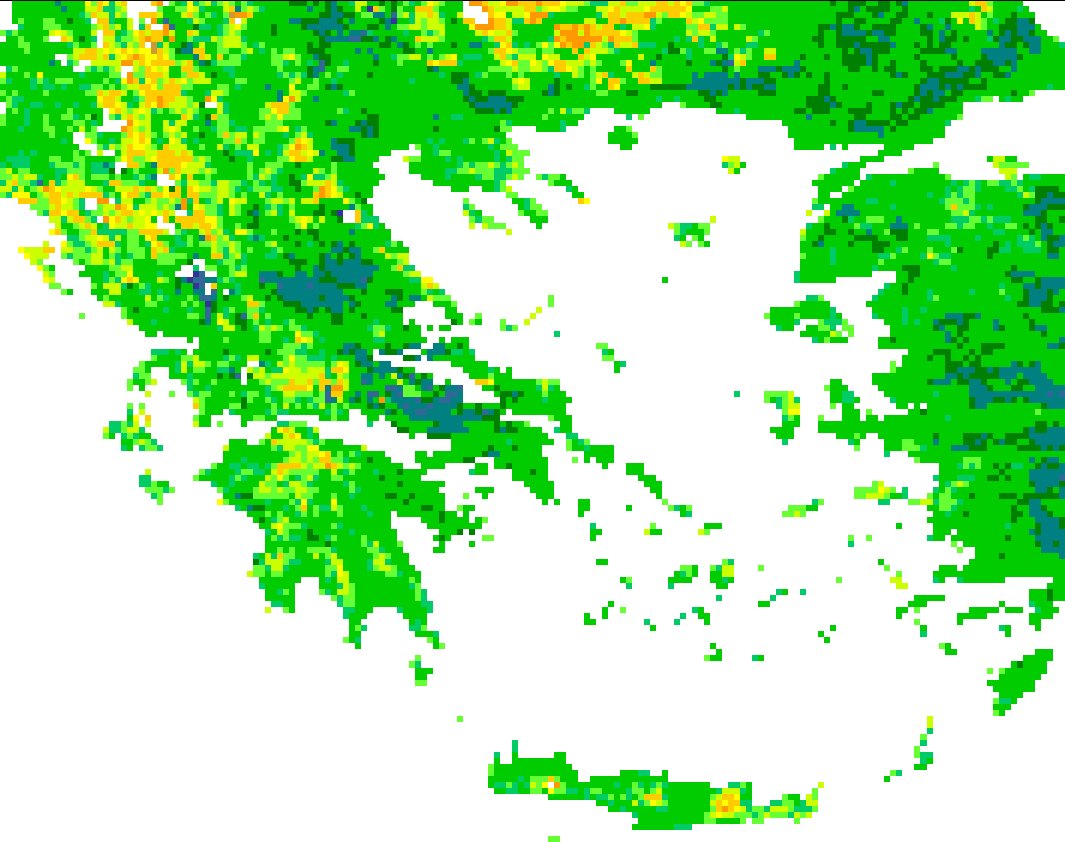
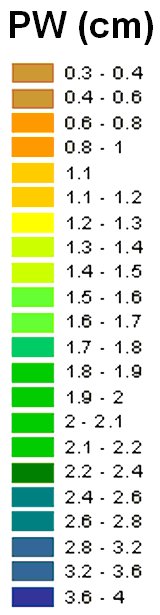
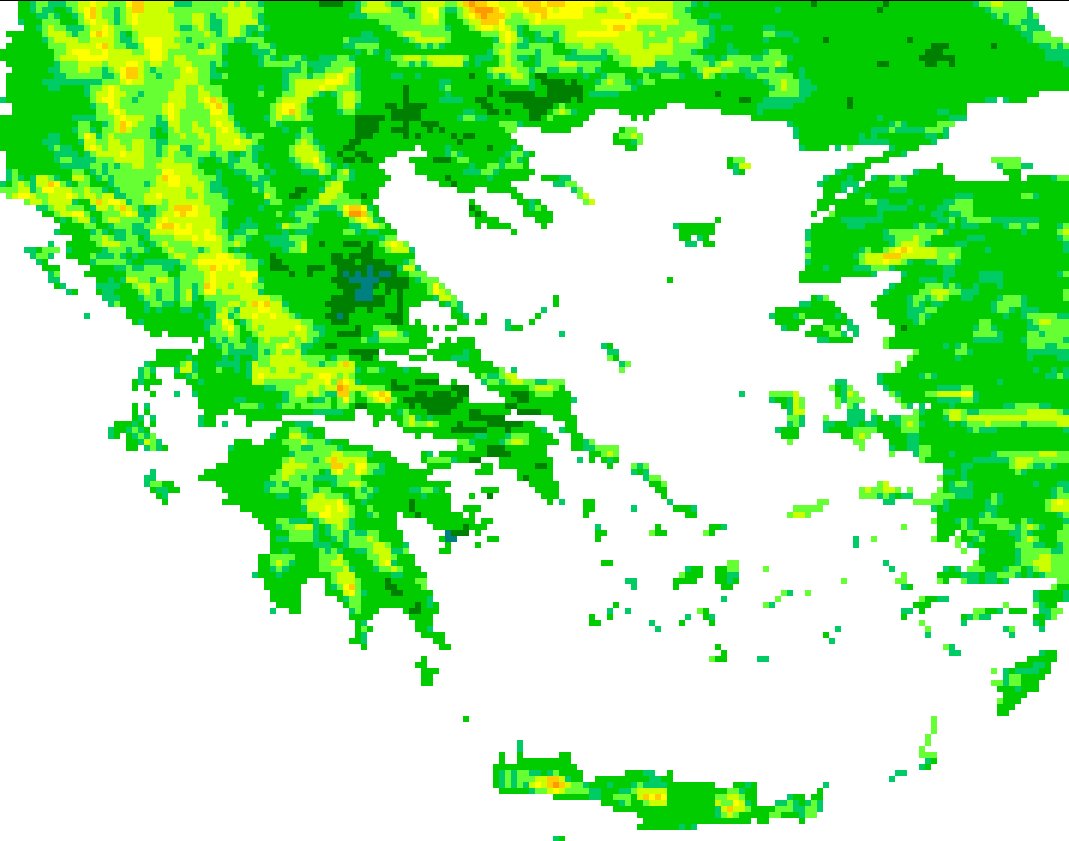
Figure 2 displays the spatial distribution of AVHRR-derived ΔΤ for the same months. ΔΤ maxima for October, January, April and July, are recorded as 3.62, 3.97, 4.78 and 4.59 K, respectively. A correspondence of monthly mean PW and ΔT spatial patterns is observed for all cases of Figures 1 and 2.
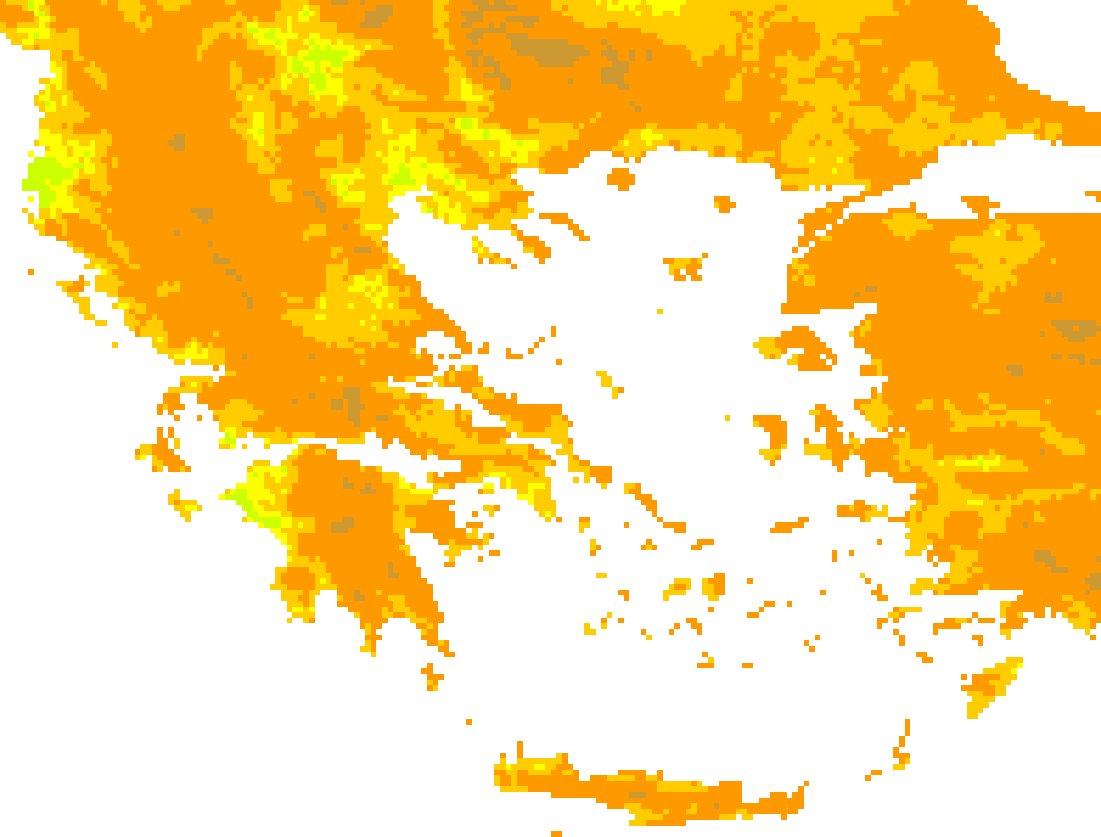
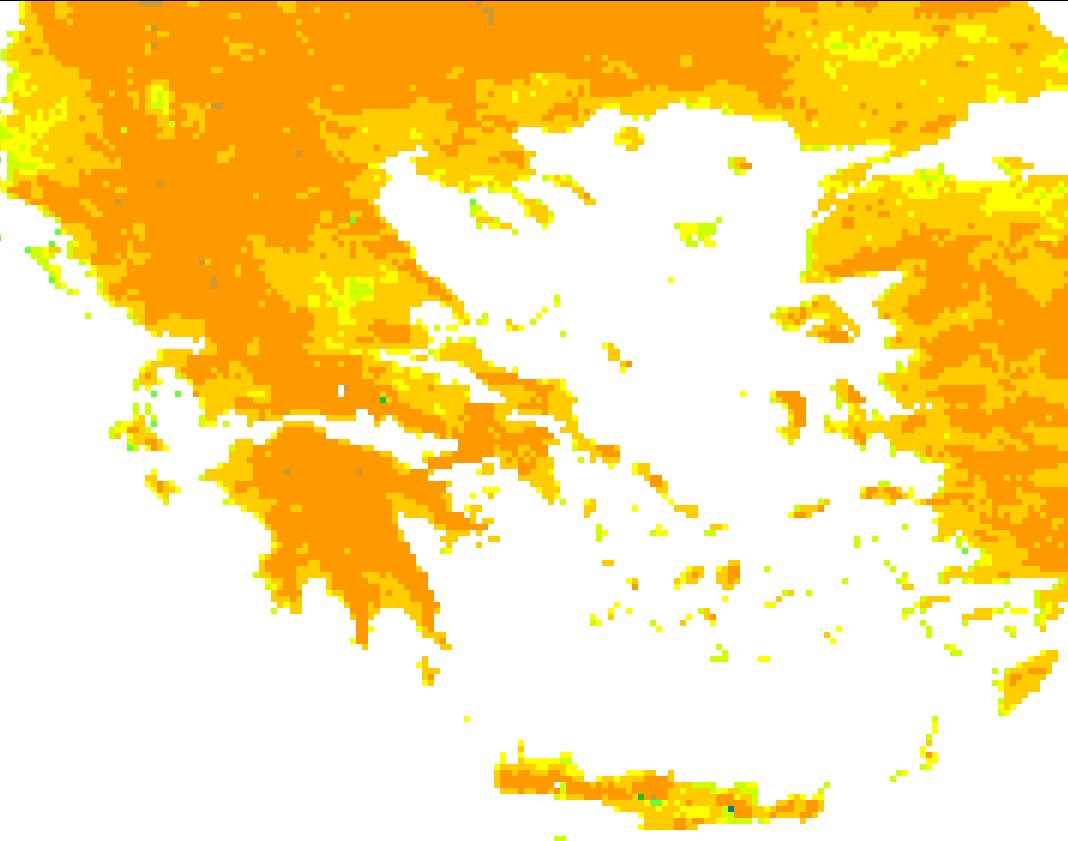
The spatial distribution of the AVHRR derived mean PW for the months January, April, July and October of the period 2001 – 2005 is shown in Figure 3, where the PW interannual and spatial variability can be observed. For better visualization and comparisons the PW values have been classified into 21 classes, the same for all months. The summer maxima and the winter minima are evident in each cell and the effect of topography is shown as well. Mean PW maxima of 1.60, 2.61, 3.96 and 2.50 cm are observed for January, April, July and October, respectively. However, of particular importance are the local maxima, which can be observed over Thessaly, Central Macedonia, East Thrace, West Albania and several less extended parts of the West Greece and Turkey, especially in the summer. All these areas are almost flat areas with high percentage of arable land. Irrigated cultivation patterns can be found in most of these areas. Irrigation favors evapotranspiration, it therefore contributes to the increase of the atmospheric humidity amounts during the growing season, as well as during the summer. Finally, it is well known that atmospheric humidity (and thus PW) increases with air temperature. The spatial patterns of air temperature over the study area are highly affected by the topography and are consistent with the observed PW patterns, especially during the summer.
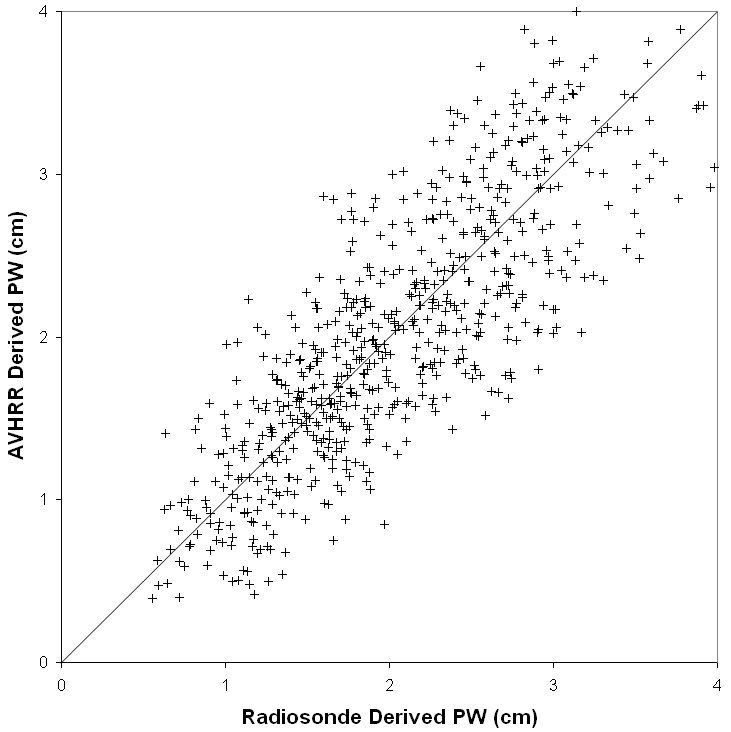
Figure 4 depicts a scatter diagram of radiosonde derived PW vs AVHRR derived PW for the whole period 2001 – 2005 (four months). Radiosonde derived PW values were found to be highly correlated with their corresponding AVHRR estimates; indeed, Pearson’s correlation coefficient was found equal to 0.812. Standard OLS estimation revealed that the intercept of the regression line equals bOLS=0.25 and the corresponding slope equals aOLS=0.87. Hence the best fitting line is close to the line with zero intercept and unit slope displayed in Figure 4, indicating the overall absence of bias in AVHRR estimation. The respective RMSE was estimated at 0.46 cm, which indicated a very good agreement of estimated and observed parameters
|
||||||||||||||||||||||||||||||||||||||