London case study
London is a metropolitan centre, with financial and globally oriented business services sectors and computing as important sources of employment. The 2008 European Cities Monitor ranked London as Europe’s top city business location. Its’ population is estimated at 7,56 million and its’ total employment is about 4,7 million, mostly in the private sector and therefore rising and falling with the economic tide.

Although London is an innovative mega-city, it faces modifications in its urban microclimate (increased temperature in the city centre, hotter summers, air quality problems) which need to be faced through a solid plan towards urban sustainability. In addition, London will host the Olympic Games 2012, a fact which further increases the potential for measures towards sustainability.
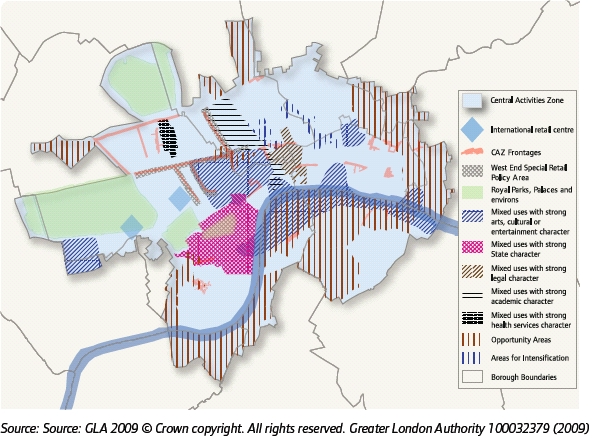
The case study area will be the Central Activity Zone (CAZ). The CAZ covers the London central area, including the Central Business Area and the commercial centre, three major parks (Hyde Park, Regent’s Park and Green Park) and some minor urban green areas. It has an overall area of approximately 3300 ha, covering 10 boroughs either entirely or partially with ca. 280.000 residential inhabitants.
The policy objectives for the case study area identified were as follows:
- To reduce overheating (reduce the UHI effect)
- To increase urban greenspace
- To mitigate flash flooding
- To decentralize energy production: heating/cooling and power generation, and
- To improve air quality.
The assessment will mainly address air quality, thermal comfort and climate change (i.e. flooding) issues, within the context of greening the CAZ.
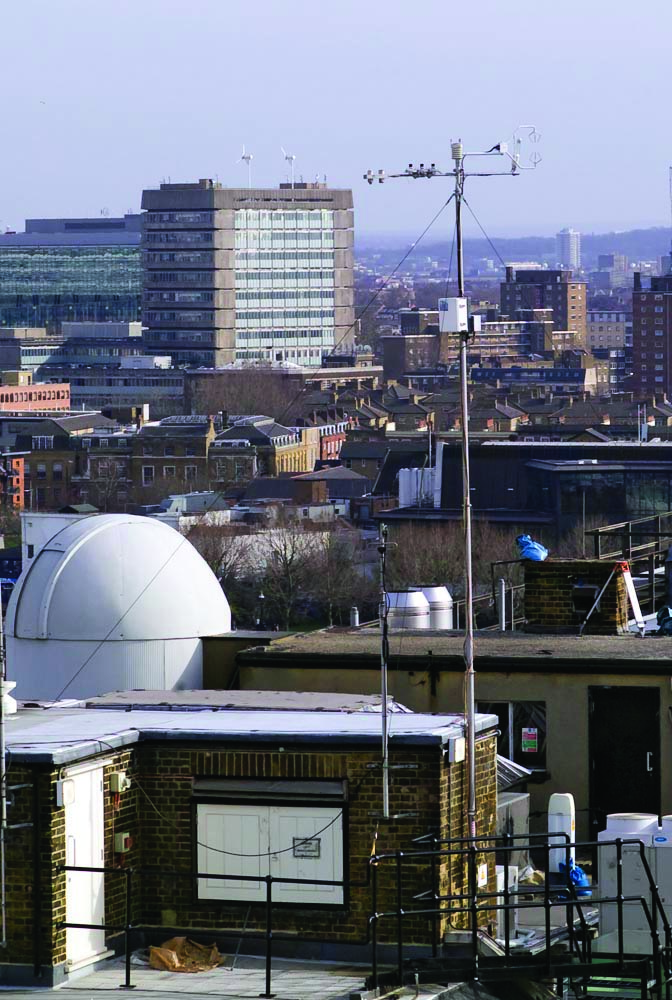
Physical Meteorology data at London are collected at two sites on the KCL Strand campus: KSK (King’s Strand King’s) and KSS (King’s Strand). The main site is KSS which became operational 1 November 2009.
A. In-situ datasets of air quality, energy, water, carbon and pollutants fluxes/concentrations
The following data will be provided:
- Time series and spatially extensive data sets of air quality and surface fluxes.
- Turbulent fluxes and distribution of trace gas and particle concentrations.
- Gas exchange of urban vegetation in relation to soil properties.
More specifically the collected data are:
Air quality:
Concentrations of H2O, CO2, NOx, CO, O3, SO2
Particle number size distribution
Principal outdoor pollutatnts (VOCs, contaminants, etc.)
Particulate matter values - PM1, PM2.5, PM10
Meteorological parameters:
Air pressure
Air temperature
Precipitation
Relative humidity
Surface temperature
u, v components
Micrometerological parameters:
All three wind components (u, v and w)
Friction velocity
Sensible and latent heat fluxes and CO2 flux
Anthropogenic heat flux
Radiation:
Up- and downward long- and shortwave radiations + PAR
UVA & UVB radiation
B. Remote sensing and GIS data and maps of energy and water fluxes, pollution concentrations, land cover and vegetation, spatial and socio-economic development
The following satellite, airborne and GIS data, in order to produce maps of energy and water fluxes, pollution concentration, land cover and vegetation, spatial and socio-economic development, are available:
- Urban land cover/land use maps
- Land classification map
- Urban vegetation data for GLA
- Land surface temperature by satellite data
- Morphological characteristics
- Morphological characteristics
- Zero plane displacement length
- Plan area index
- Frontal area index
- Sky view factors
- Anthropogenic heat flux
- Maps of sensible heat flux based on different modelling approaches
- PM10 concentration map
- Total emission predictions map (for each borough and emission sources)
- 3D maps of city
- Airborne images (hyperspectral radiances, broadband radiances)
- Digital Elevation Model (DEM)
- High resolution satellite data products
- Population census data
- 3D data set
- Boundary data maps of Great Britain (urban features and London borough boundaries)

